Rule sdge_visual
Purpose
Rule sdge_visual is designed to display the spatial expression of specific gene categories in colors red, green, and blue via spatula. NovaScope enables the visualization of >=1 gene sets. The gene categories for visualization can be defined in the config_job.yaml file (refer to Parameters).
Input Files
- Spatial Digital Gene Expression Matrix (SGE) and Associated Files
The necessary inputs include a spatial digital gene expression matrix (SGE), generated by Rule
dge2sdge.
Output Files
The rule generates the following output in the specified directory path:
1 | |
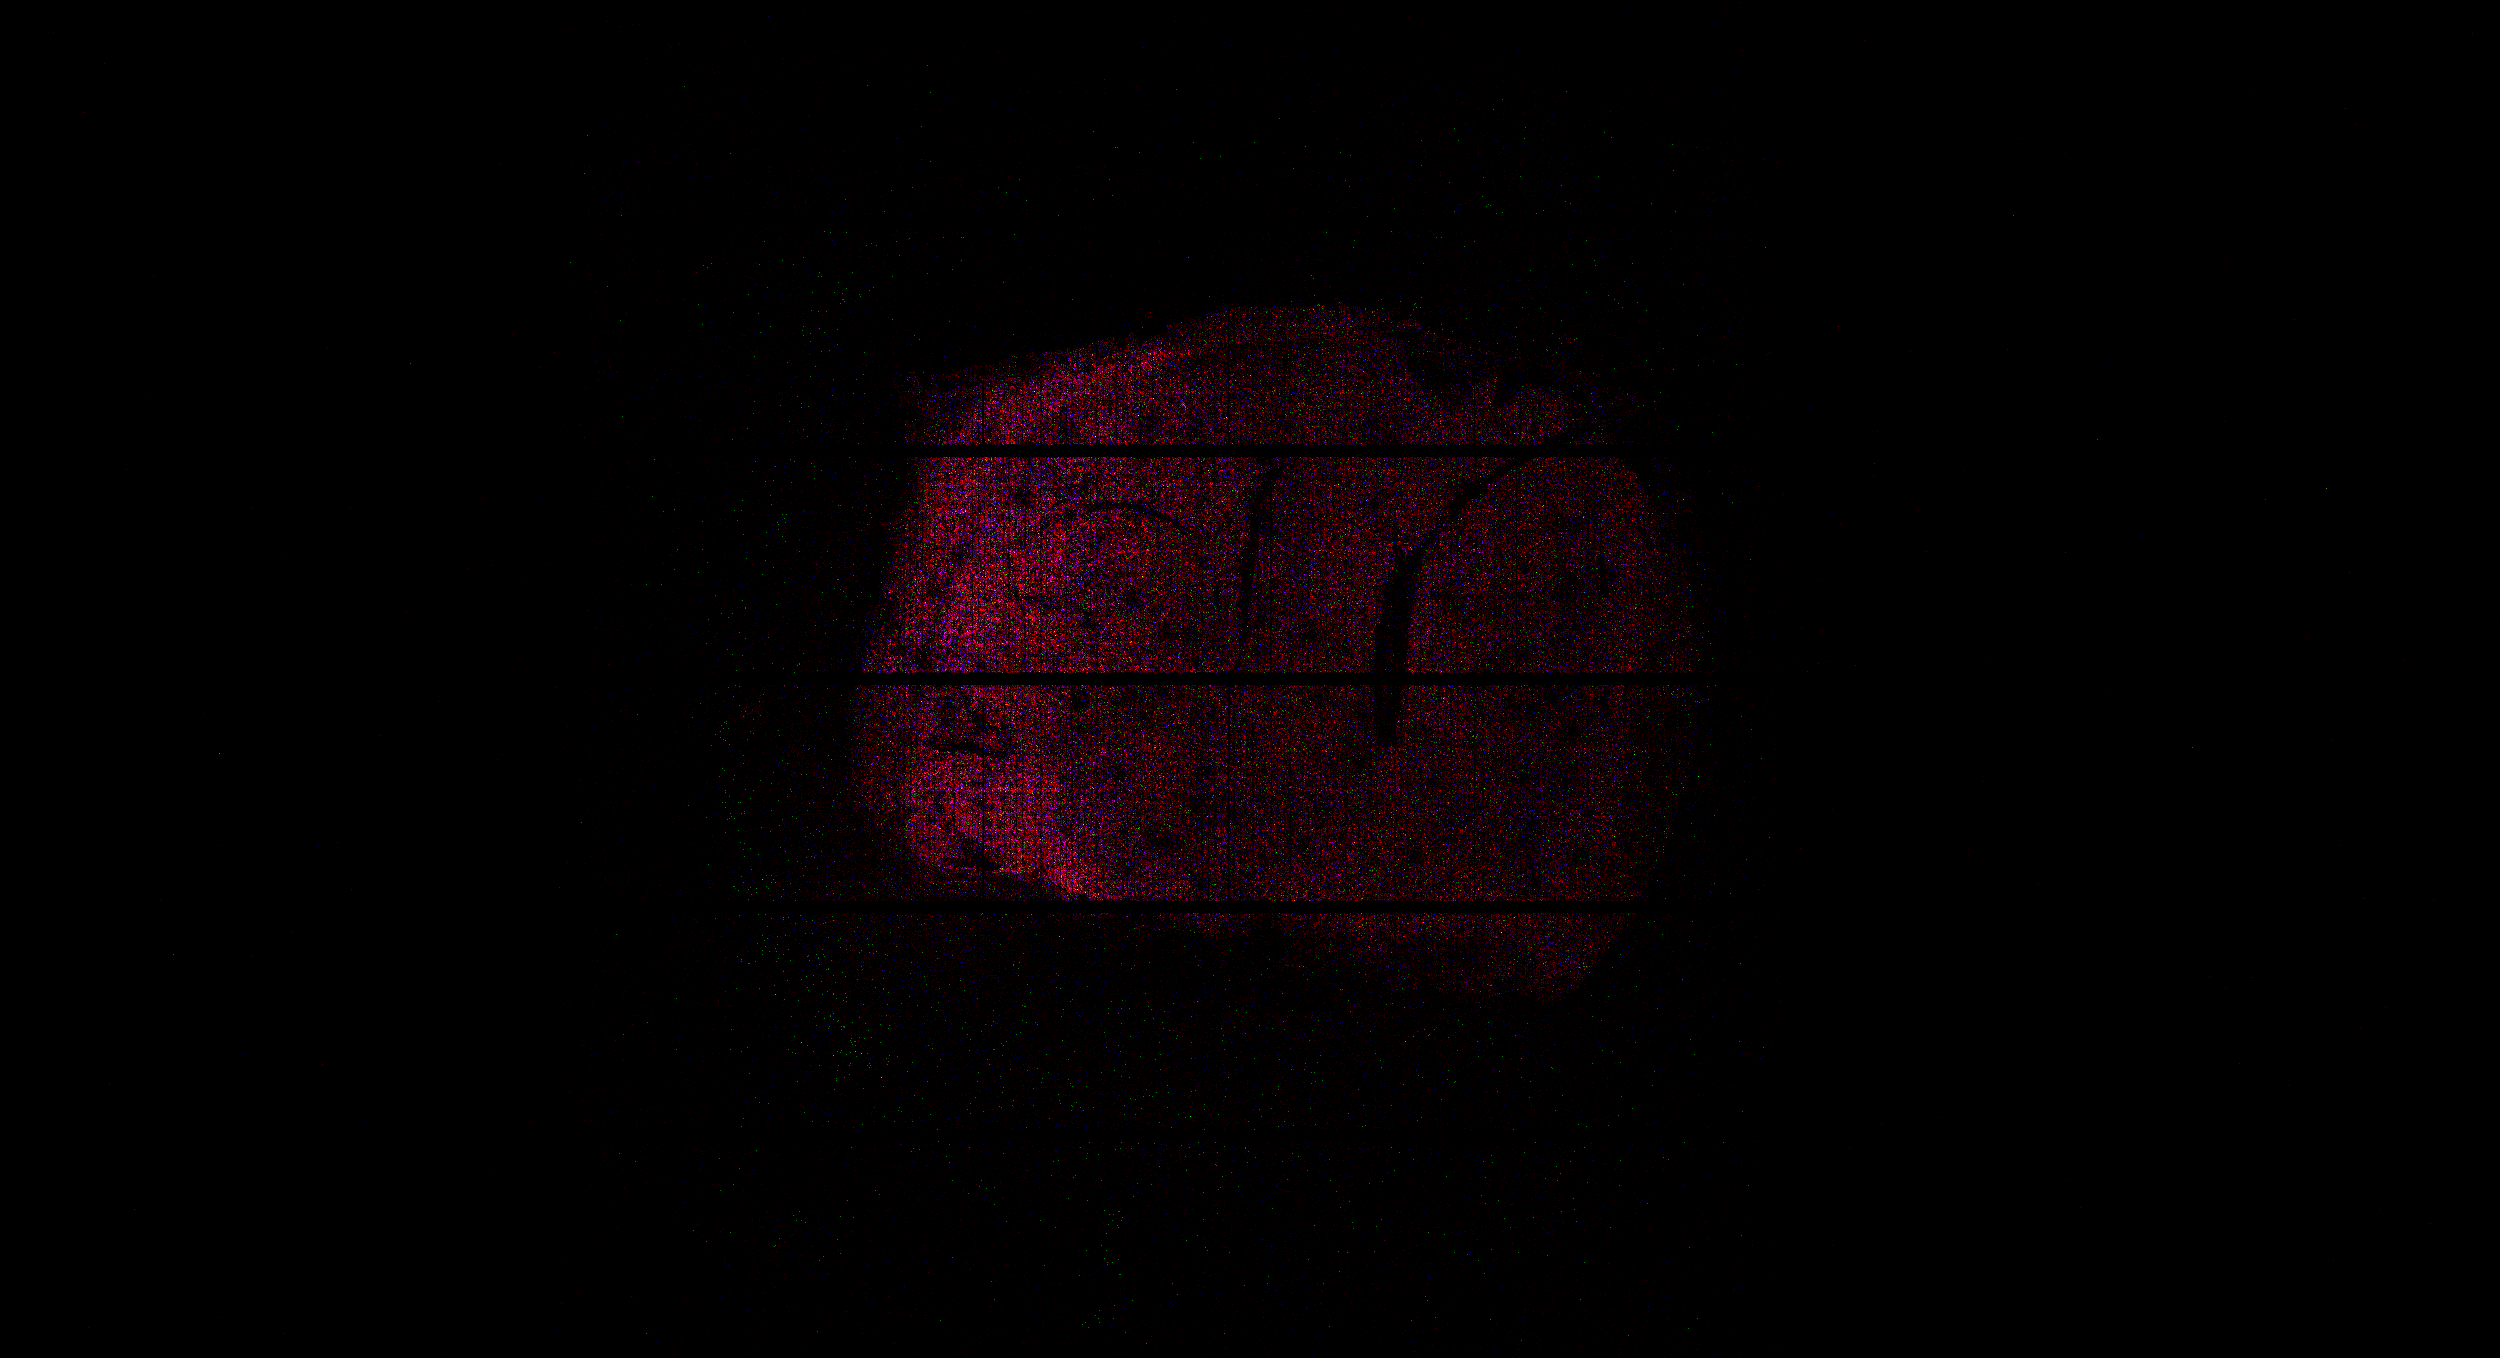
Description: A PNG file is created for each set of genes specified. By default, the spatial expression of non-mitochondrial genes, unspliced genes, and mitochondrial genes are depicted in red, green, and blue, respectively.
File Naming Convention:
1 | |
The default visualization of non-mitochondrial gene, unspliced genes, and mitochondrial genes will be named as nonMT_Unspliced_MT.png.
File Visualization:
Output Guidelines
It is recommended to review the spatial distribution of specified gene sets corresponds with the tissue area.
Parameters
1 2 3 4 5 6 7 8 9 10 11 | |
-
The
genesParameter indrawsgeNovaScope includes a selection of predefined gene lists with the following options: all (all genes); nonMT (non-mitochondrial genes); ribosomal (ribosomal genes); MT (mitochondrial genes); and nuclear (nuclear genes). To visualize additional specific gene groups, users can create gene list files (<prefix>.genes.tsv) in the directory specified in theirconfig_env.yaml. Additionally, it is possible to visualize individual genes or groups of genes using specific names or regular expressions withspatuladirectly. -
Other
drawsgeParameterscoord_per_pixelspecifies how many coordinates should be merged into one pixel. The default setting is 1000.0.auto_adjustcontrols whether to automatically adjust the color intensity based on the maximum count. It is set to True by default.adjust_quantiledefines the quantile among non-zero pixels to use for auto-adjustment. The default value is 0.99.
Dependencies
Given the input from Rule dge2sdge serve as the input for sdge_visual, Rule sdge_visual can only execute if the input SGE is available or the dependent rules have successfully completed their operations. See an overview of the rule dependencies in the Workflow Structure.
Code Snippet
The code for this rule is provided in a06_sdge2sdgeAR.smk.