Getting Started: Explore a Spatial Dataset
Welcome to CartoScope! This guide will walk you through the essentials of exploring a spatial dataset, from logging in to sharing your discoveries.
Step 1. Account Setup
CartoScope uses your Google account for secure access and to manage your personalized features like bookmarks.
- Click the Profile Icon (top-right) and select Login.
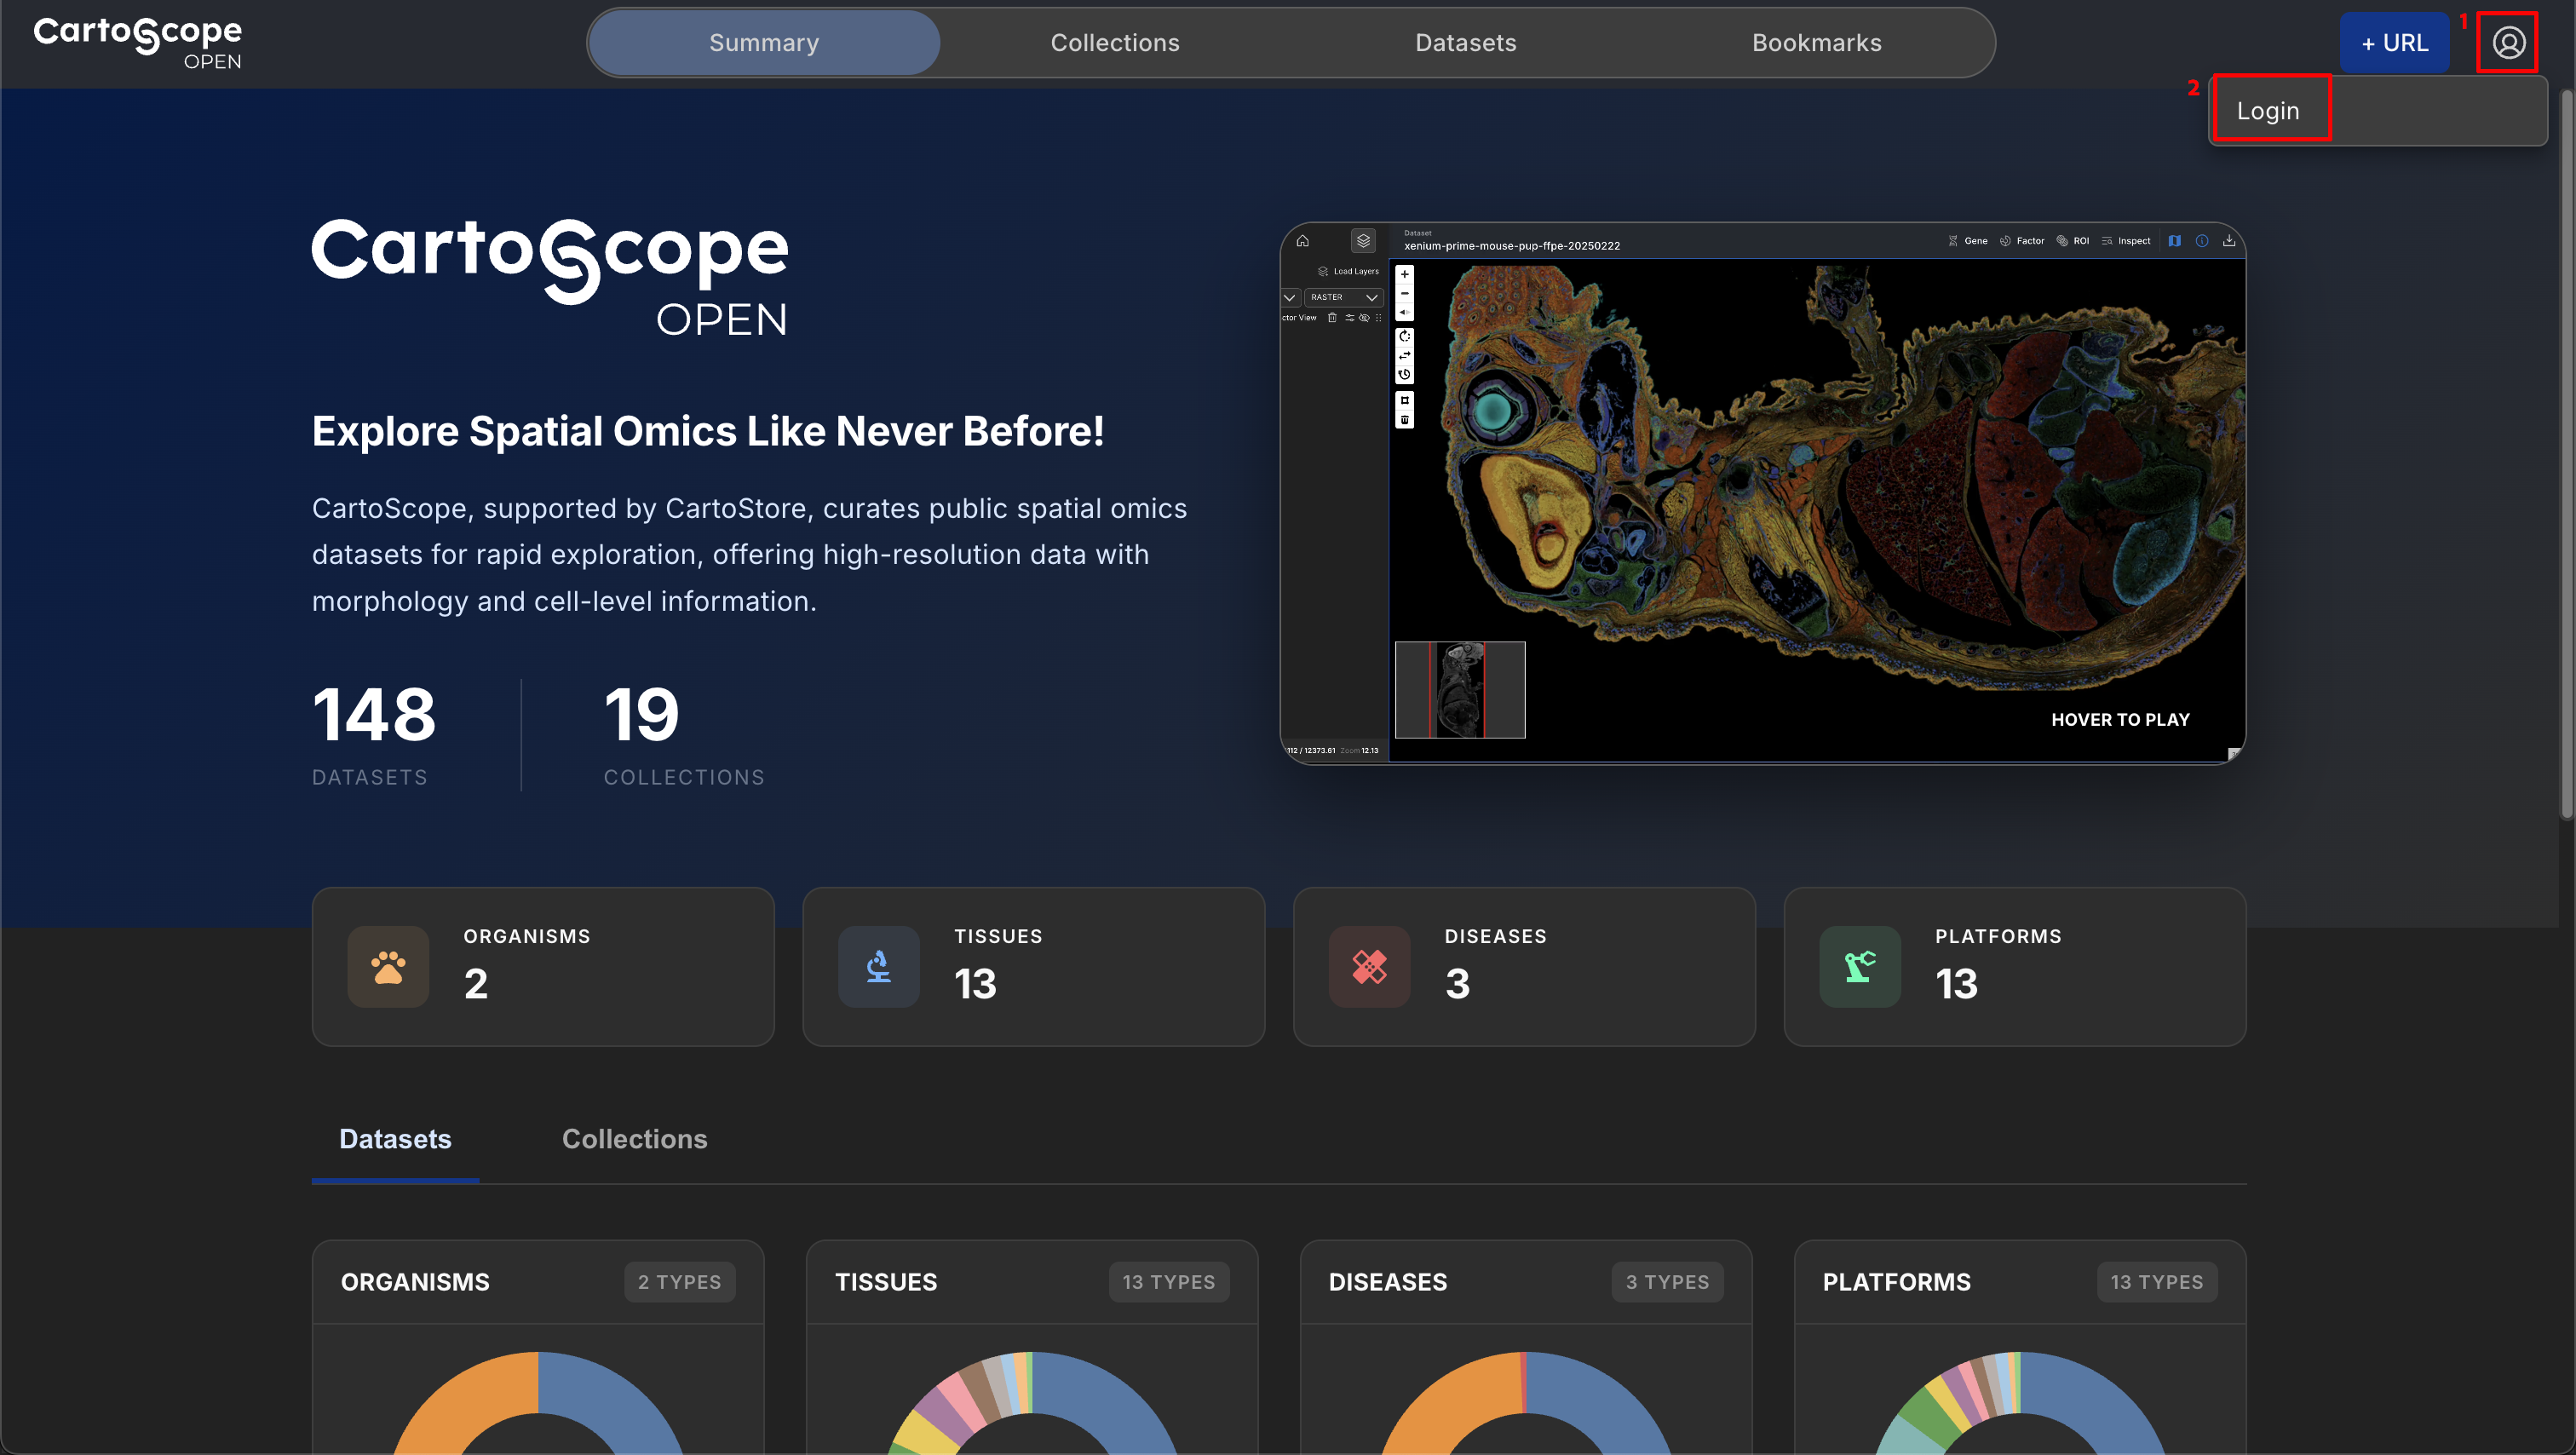
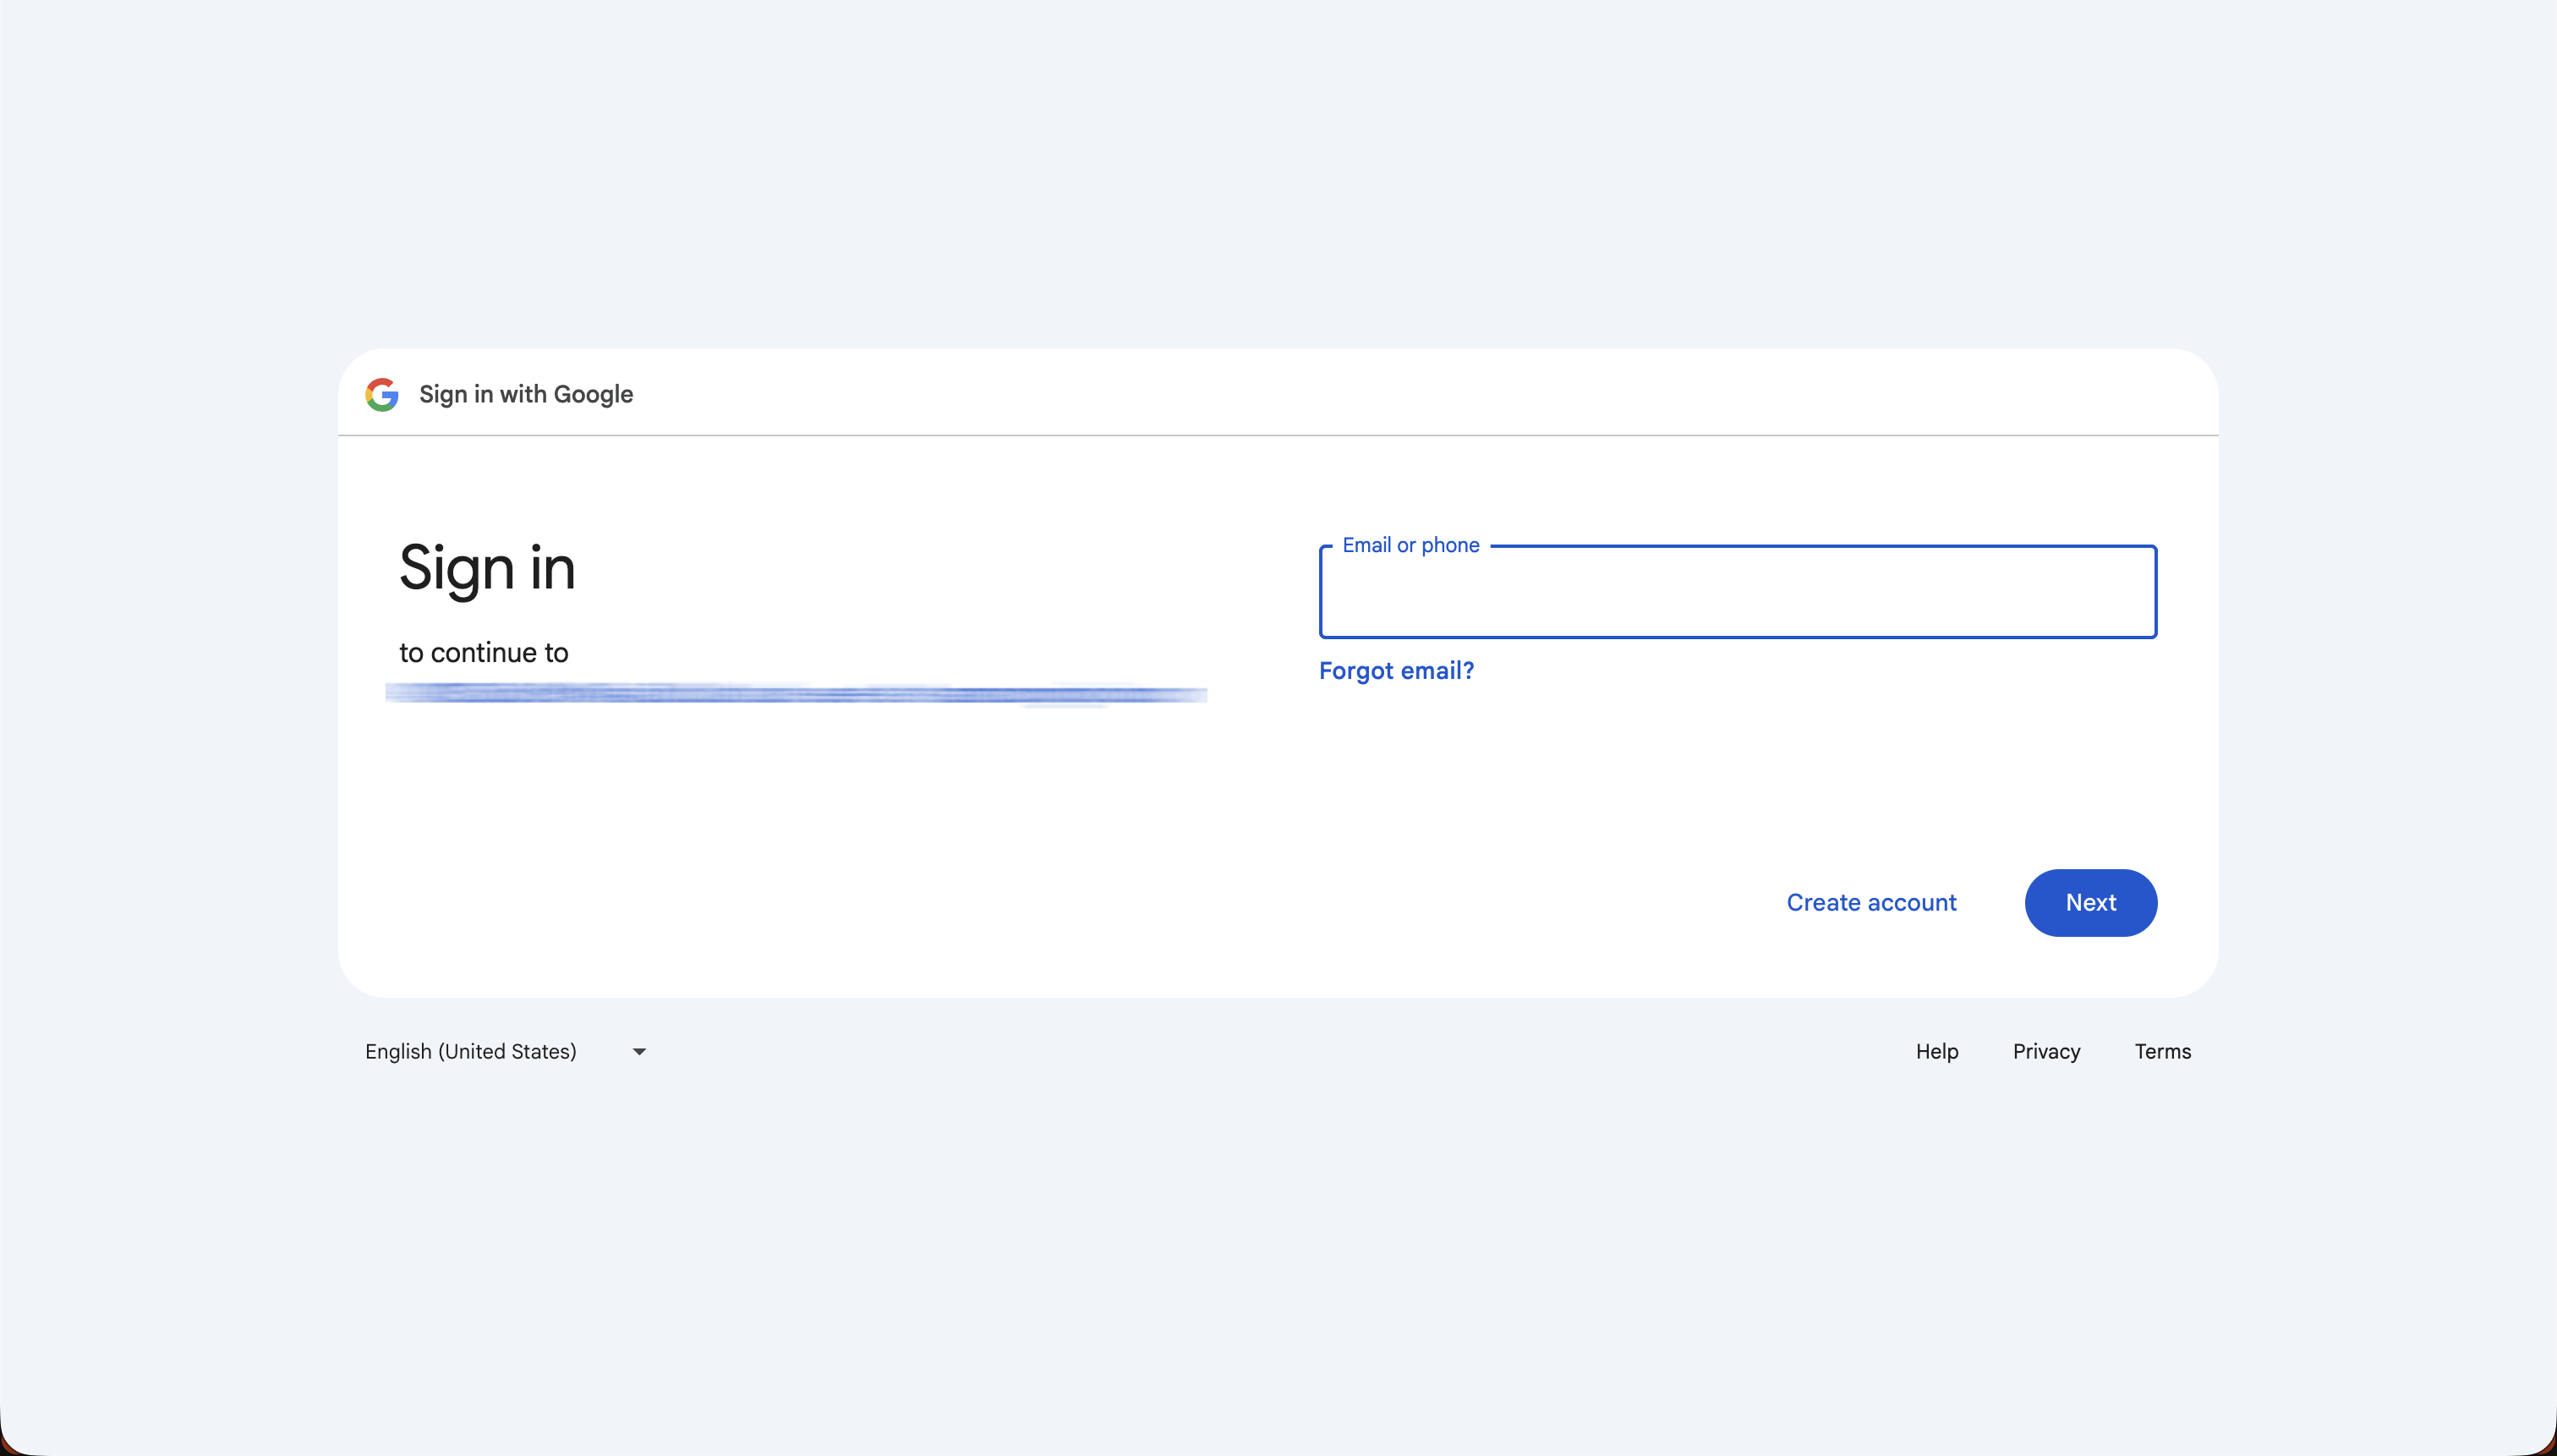
- If you are a new user, register with your Google account.
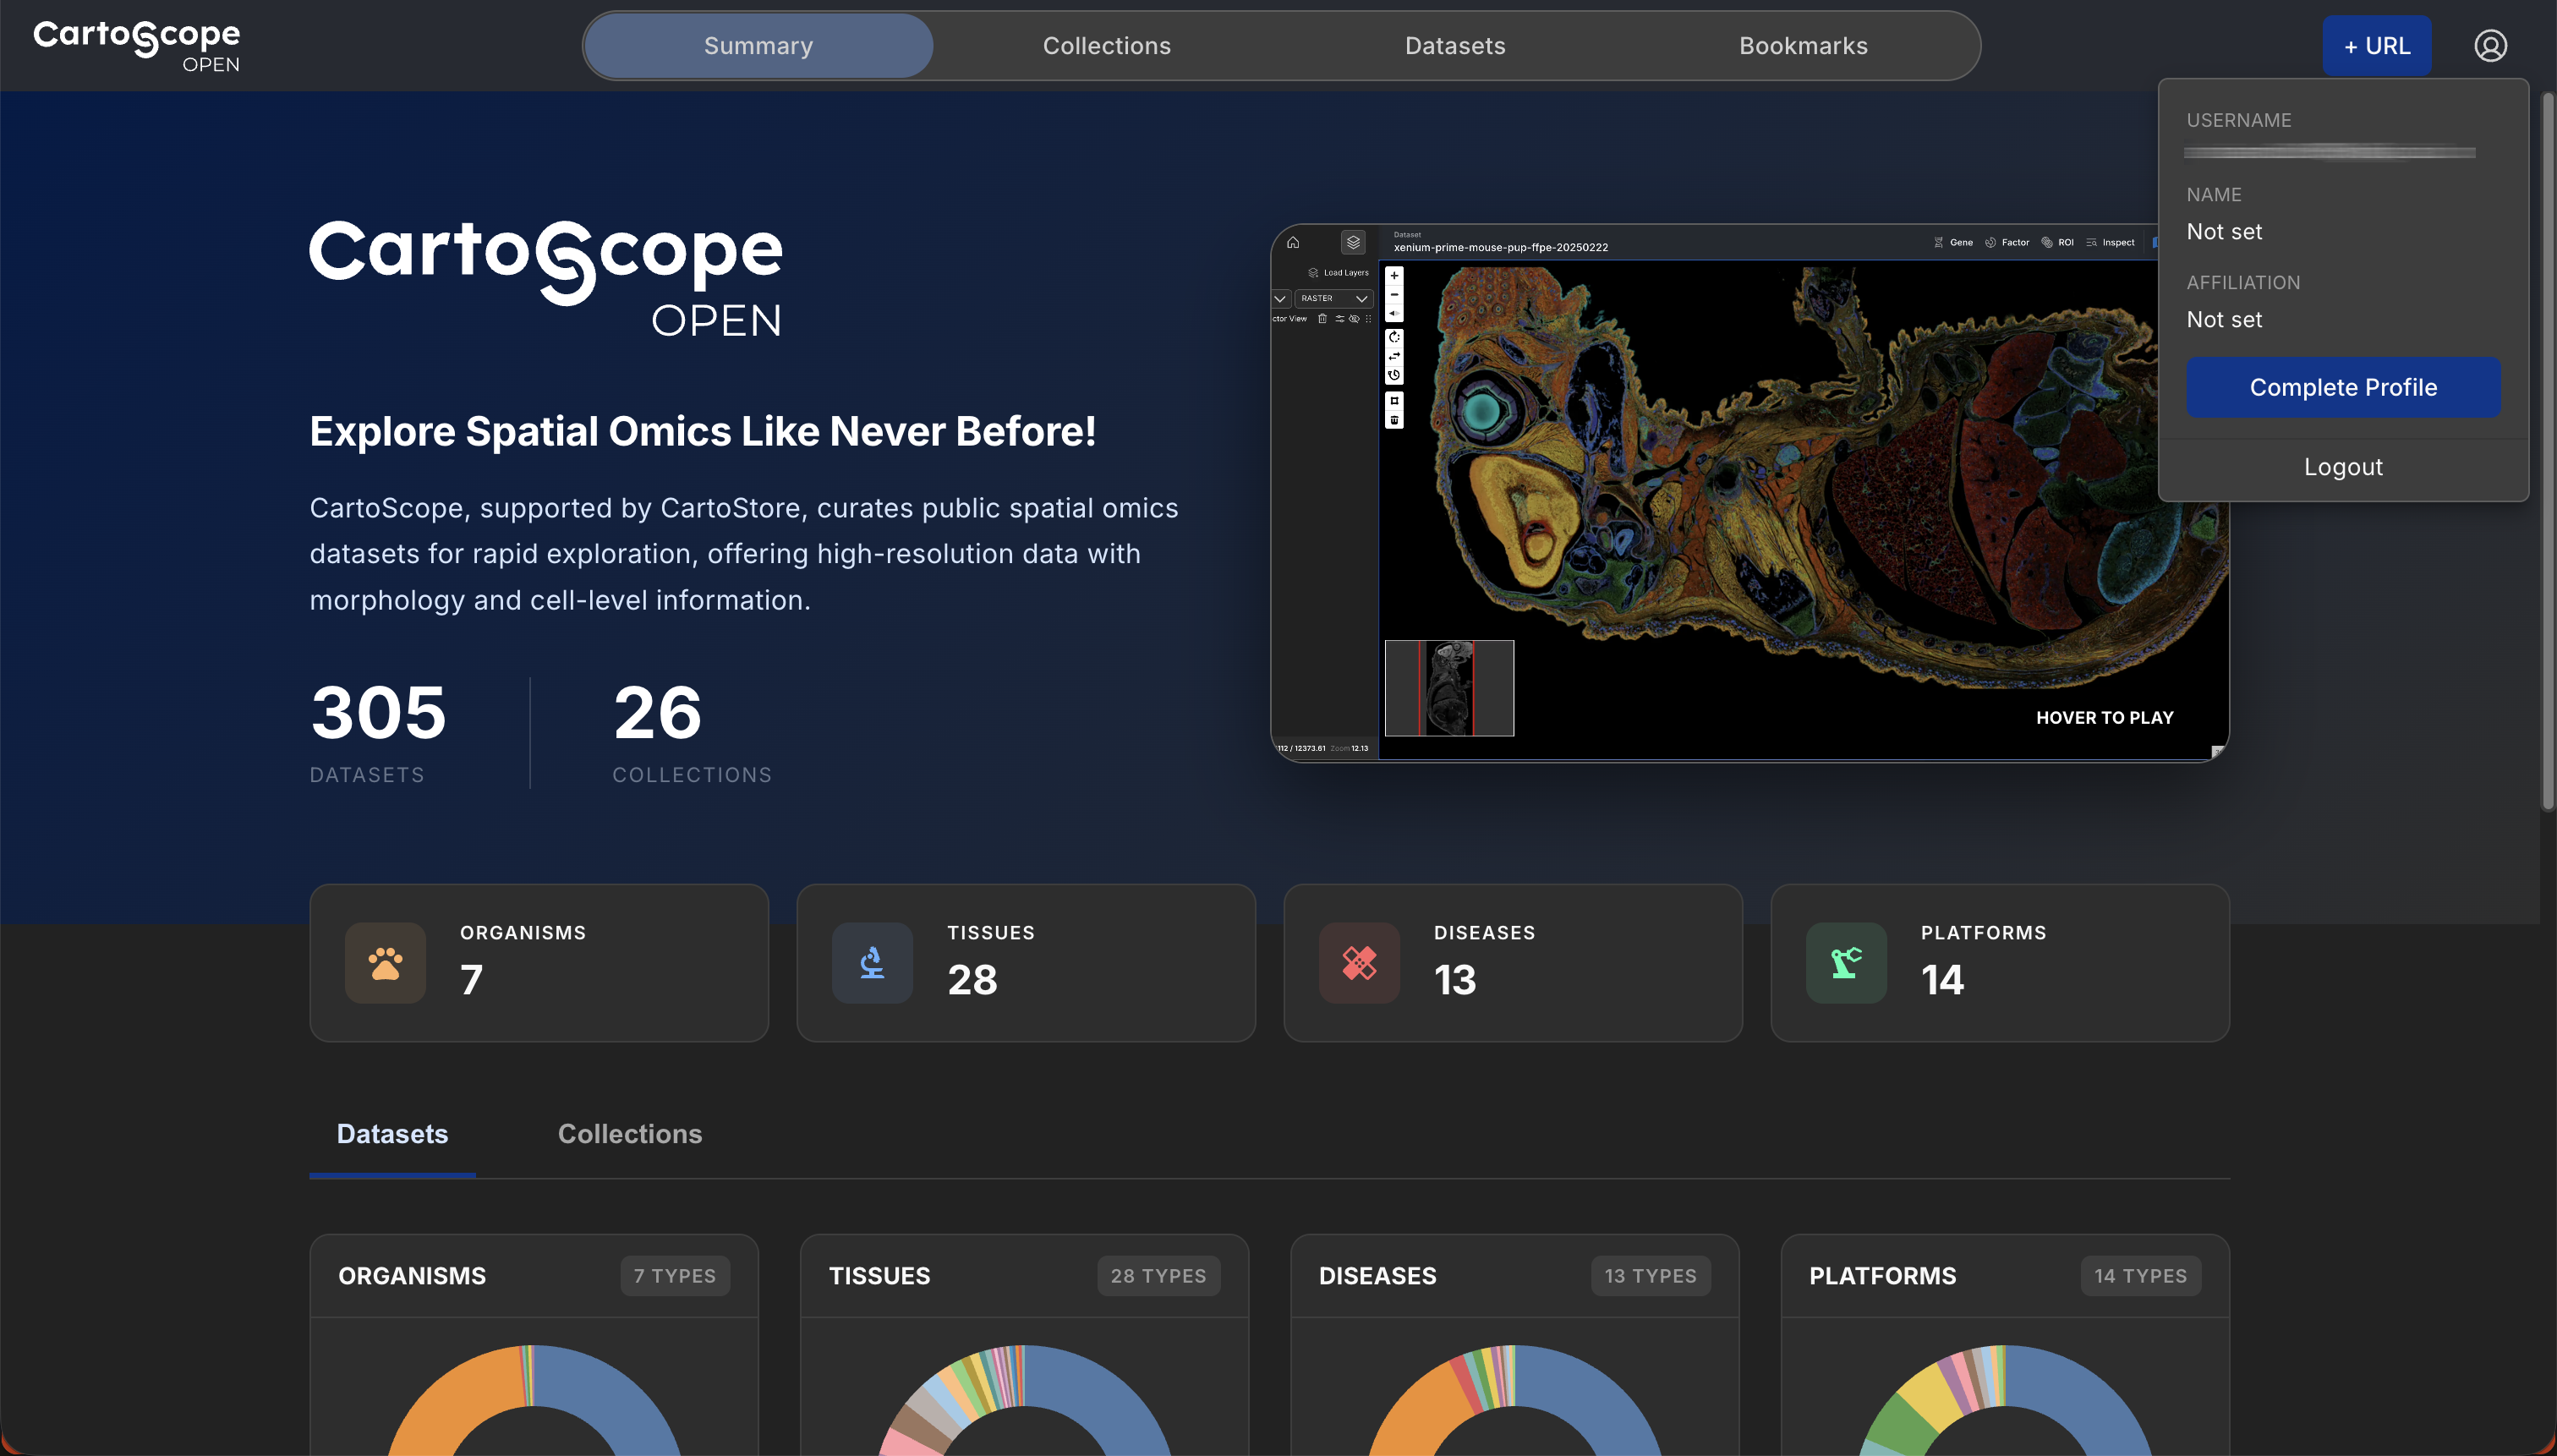
- Click the Profile Icon to verify your information. Your email address will be shown as username. If your name and Affiliation is not shown, select Complete Profile to finish the registration.
Privacy & Identity
We display your Name and Affiliation (not your email) to identify you as the author of any public bookmarks you create.
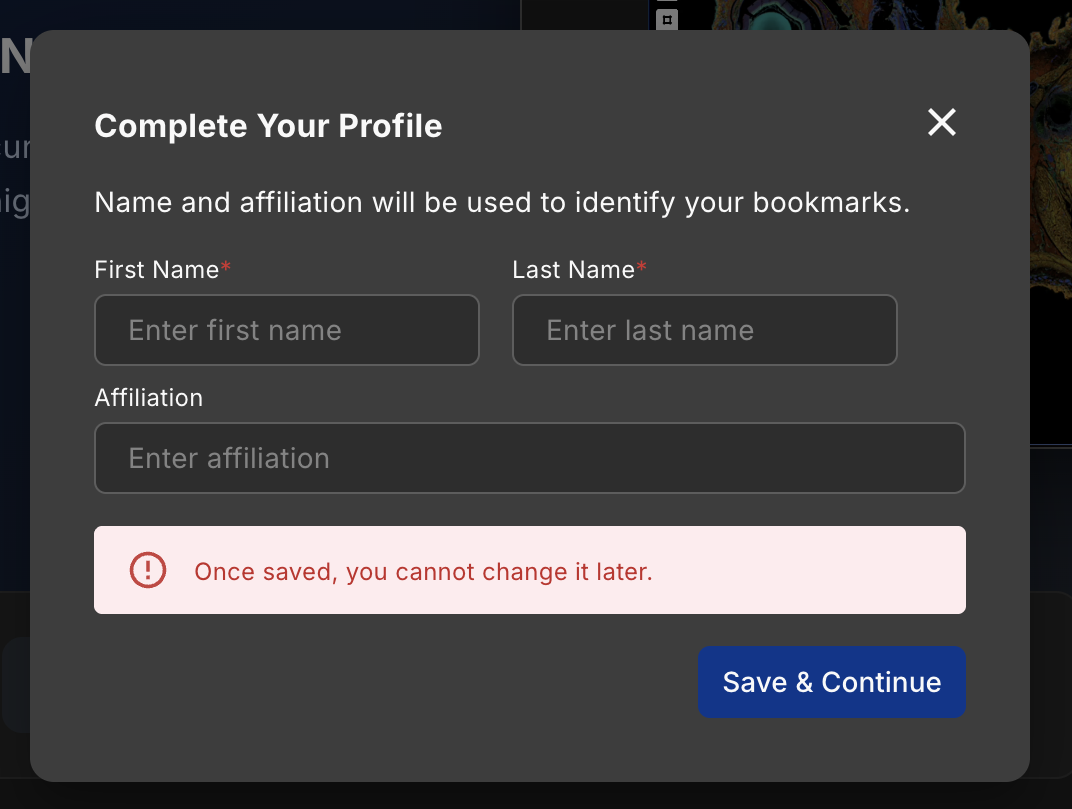
Complete Profile
You must complete your profile to create bookmarks.
This profile information is permanent. Contact an administrator at cartoscope@umich.edu if you need to change it later.
Step 2. Load a Dataset
The Data Catalog is your gateway to public spatial omics data.
- Navigate to the Data Catalog.
- Browse & Filter: Use the sidebar filters to narrow down datasets by Species, Tissue, Technology, or Disease.
- View Options: Toggle between Table View (for details) and Gallery View (for thumbnails).
- Launch: Click on a dataset name or card to open it in the viewer.
Step 3. Explore the Map
Once loaded, you can interact with the spatial data:
- Pan & Zoom: Use your mouse or trackpad to move around the high-resolution tissue map.
- Layers: Open the Layer Drawer (left sidebar) to toggle different visualization layers (e.g., H&E image, Gene Expression, Factors).
- Inspect: Hover over spots or cells to view their specific data.
Step 4. Add Layers
The Layer Drawer (left sidebar) controls everything visible on the map. Use it to build a multi-layer view.
- Click Load Layers at the top of the Layer Drawer.
- Choose a layer type:
- Background Layer: Morphology images (H&E, DAPI, fluorescence).
- Factor Layer: FICTURE spatial factor analysis results.
- Gene / Gene Group Layer: Expression pattern for one gene or a group.
- Click + next to the layers you want to add.
For step-by-step details, see How to Add Layers.
Step 5. Investigate Factors
Factor layers encode spatial patterns inferred by FICTURE — think cell-type or tissue-domain distributions.
- Open a factor layer by clicking its name in the Layer Drawer.
- The Factor Drawer (right sidebar) shows the factor grid, marker genes, and UMAP.
- Double-click a factor chip to highlight it on the map and UMAP.
- Single-click a factor chip to view its top marker genes.
To customize factor names, use How to Add Alias. To adjust colors, see How to Change Factor Color.
Step 6. Explore Gene Expression
- Open the Gene Drawer (right sidebar) by clicking a gene layer in the Layer Drawer.
- Use the search bar to find a gene of interest.
- Click + next to a gene name to add it as a new layer.
See How to Add a Gene or How to Add a Gene Group.
Step 7. Define a Region of Interest (ROI)
Isolate a specific tissue region for quantitative analysis.
- Open the ROI Drawer (right sidebar) and click Create.
- Select the Polygon Tool and draw your region on the map.
- Click Confirm, then name the ROI and choose a data source.
- View the marker genes, export the data, or compare two ROIs side-by-side.
See How to Create a ROI and How to Compare two ROIs.
Step 8. Share Your Results
Preserve your analysis or collaborate with others.
Reference
You can find more detailed instructions on specific features in the following documents:
- User Manual: A comprehensive guide to all interface elements and features.
- How-To Guides: Step-by-step instructions for common tasks.