ROI (Region of Interest) Drawer
The ROI Drawer enables you to define, manage, refine, and perform comparative statistical analysis on specific spatial regions within your tissue section. You can draw custom polygons, automatically detect tissue contours, upload/export geometry files, and run differential expression comparisons between multiple regions.
Interface
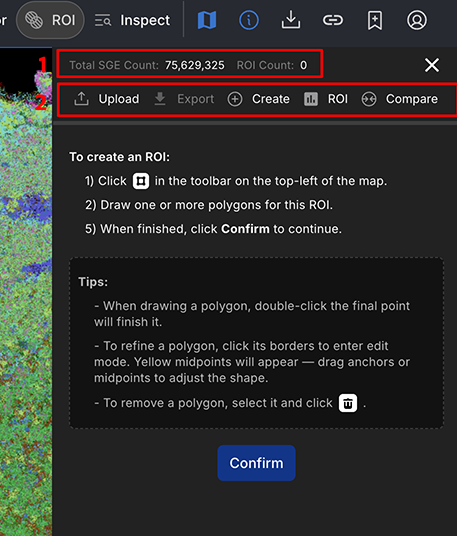
1. ROI Summary Bar
Located at the top of the ROI Drawer:
- ROI Count: Displays the total number of custom spatial ROI polygon shapes currently defined on the map.
- Total Transcript Count: Displays the total transcript count across the dataset.
2. ROI Action Toolbar & Operations
The drawer is organized into five operational tabs:
- Create Tab:
- ROI Drawing Tools: Pick any of the four drawing tools from the Map Toolkit:
- Polygonal Lasso: Click points to draw precise geometric polygons; double-click to close.
- Tissue Wand: Automatically detect and outline tissue boundaries from raster image layers (H&E, fluorescence, raster factor maps) using marching squares contour algorithms. Includes interactive Island mode to pick individual tissue slices with a single click.
- Brush Tool: Paint freehand strokes to add area to your shape (with size slider and [ / ] hotkeys).
- Eraser Tool: Freehand carving tool to carve out internal cavities (e.g. ventricles, lumen) or trim noisy borders.
- Top Options Bar: Access live coordinates (\(X\), \(Y\)), real-time dynamic length/perimeter and area measurements with automatic units, multi-polygon counters, and tool configuration.
- Multi-Polygon Shapes: Draw multiple disconnected polygons to create compound ROIs representing multi-focal anatomical structures.
- ROI Definition: Enter an ROI identifier name and select the desired ROI Data Loading Option (Current-Level Loading vs. Full ROI Loading).
- Confirmation: Click Create (or Confirm) to save the finished ROI.
- ROI Drawing Tools: Pick any of the four drawing tools from the Map Toolkit:
- Upload Tab: Import external geometry files (e.g. GeoJSON, JSON polygon boundaries) via the upload dialog.
- Manage Tab: Edit ROI names, stroke/fill colors, and data loading options. Merge two or more ROIs into a single region, download geometry data, or delete individual ROIs.
- ROI Stats Tab: Display single-ROI summary statistics, enclosed transcript counts, and gene expression metrics.
- Comparison Tab: Select two or more defined ROIs (e.g.
ROI 1vsROI 2) to run differential expression analysis, view interactive volcano plots, and export statistical results tables.
Related Pages
Concepts
- What are Tissue Wand Parameters?
- What are ROI Loading Data Options?
- What are Layer Types?
- What is Total Transcripts?
Manual Pages
- [Map View (Center Stage)](./map.md)
How-to Guides
- How to Create an ROI
- How to Refine an ROI
- How to Load Existing ROIs
- How to Compare ROIs
- How to Export ROI Data
FAQs