Map View (Center Stage)
The central area is the Map View, serving as the primary interactive canvas for exploring spatial data. It renders multi-layered visual outputs (histology, genes, factors), supports zooming/panning navigation, and provides tools to rotate, flip, or draw polygons for Region of Interest (ROI) analysis.
Interface
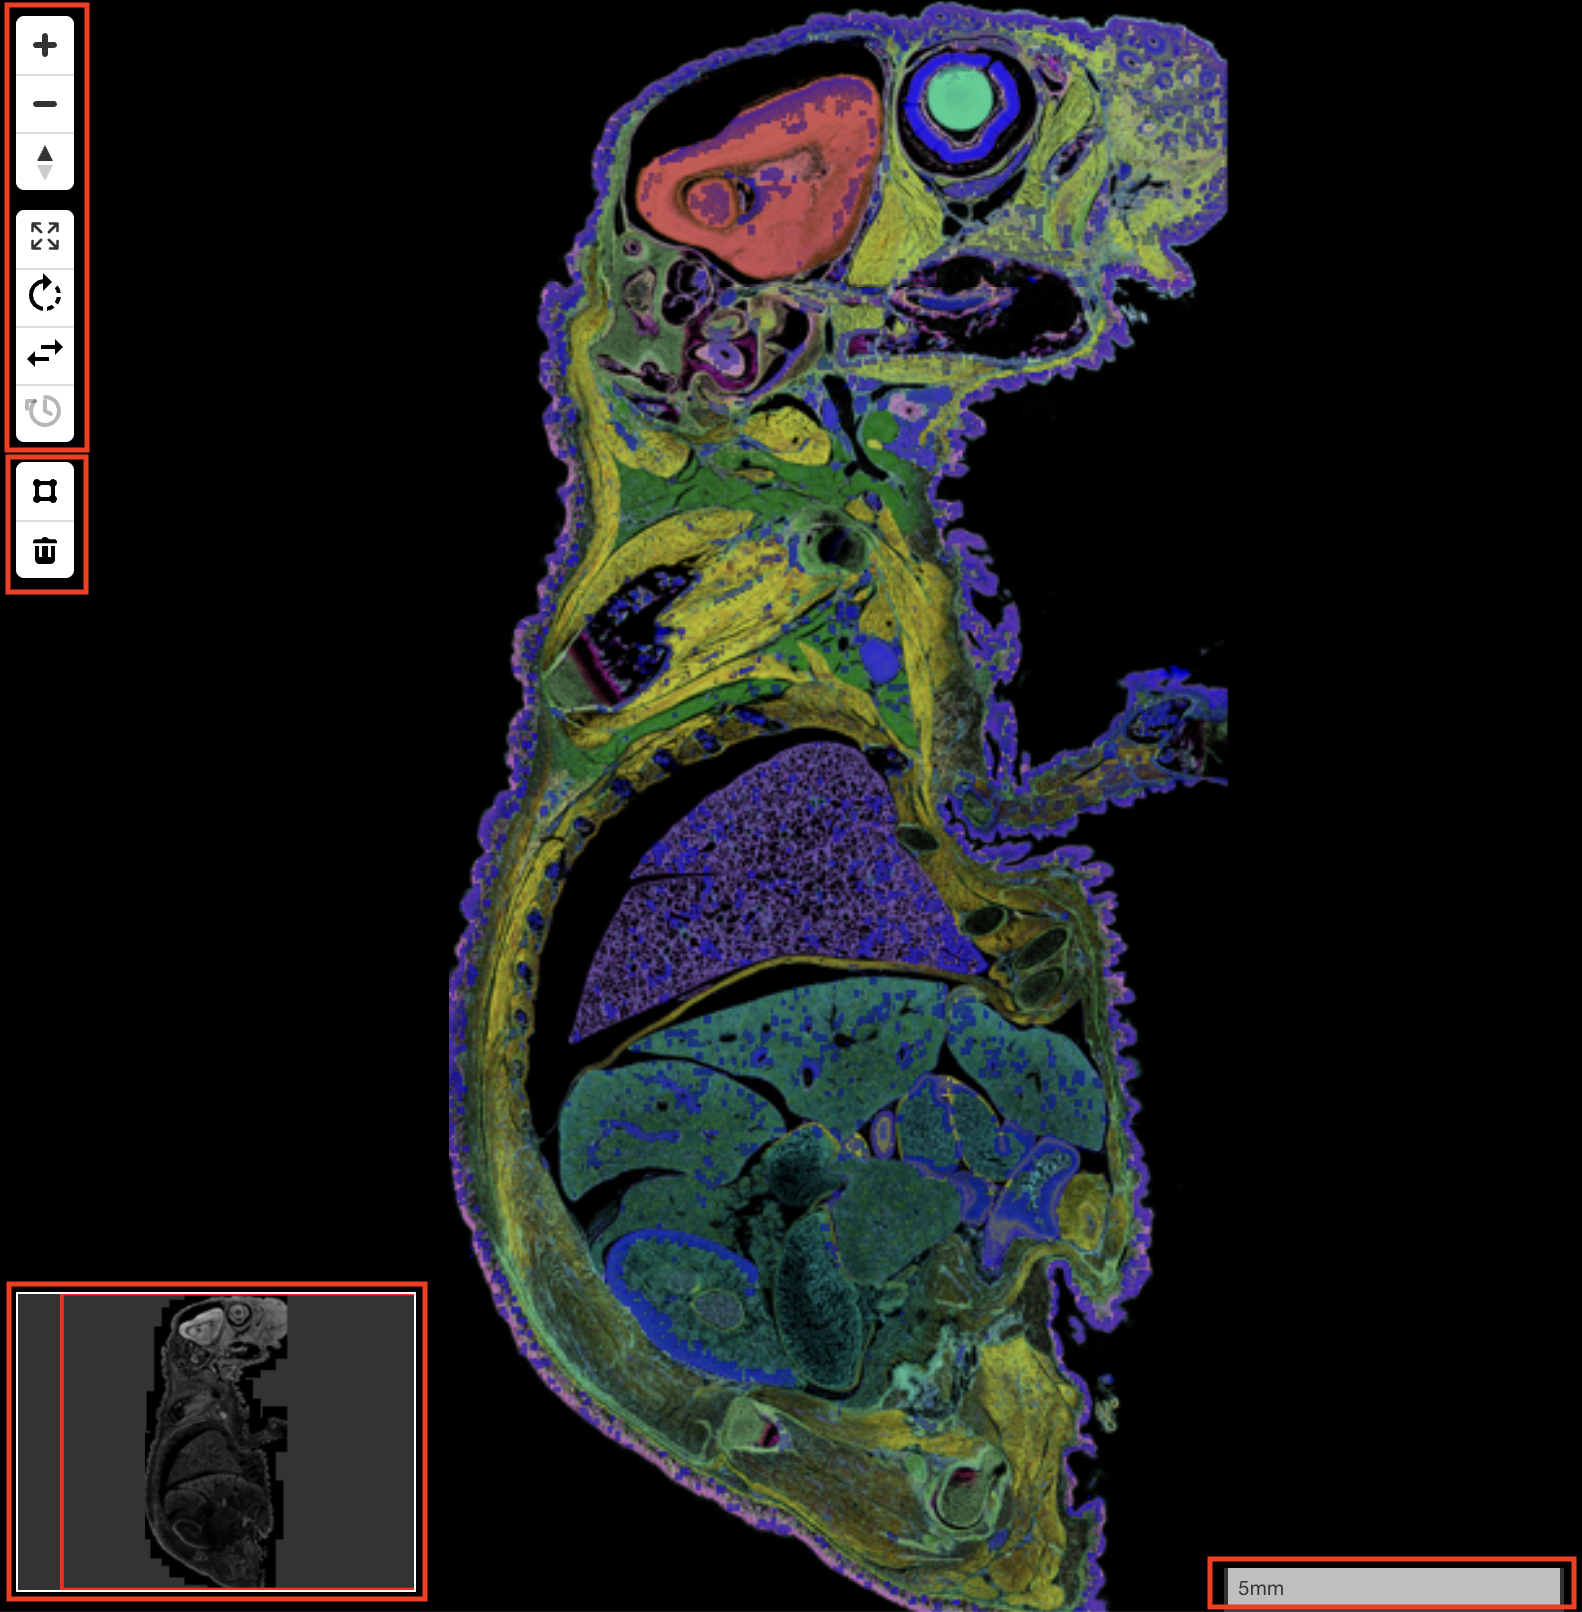
1. Navigation & Orientation Controls
Located at the top-left of the map, these buttons allow you to adjust the view:
Layout Controls:
- Left Drawer Shift: Toggle automatic map canvas shifting when opening the left layer drawer.
- Right Drawer Shift: Toggle automatic map canvas shifting when opening the right analysis drawers.
Standard Navigation:
- Zoom to SGE: Zooms to fit the Spatial Gene Expression density map.
- Zoom In (+): Increases the zoom level.
- Zoom Out (-): Decreases the zoom level.
- Scale Bar Settings: Configure scale bar visibility and automatic or custom scale units.
- Reset Compass: Resets the map bearing to North (appears when rotated).
Orientation Controls:
- Rotate 90°: Rotates the map 90 degrees clockwise.
- Flip Horizontal: Toggles a horizontal flip of the map view.
- Reset Orientation: Resets rotation and flip to their default states.
2. ROI Drawing Tools
Located below the orientation controls in the Map Toolkit:
- Polygonal Lasso (Polygon Tool): Click to place vertices and draw custom geometric polygons. Double-click or click the initial point to close the shape. While placing points, press Backspace or Delete to remove points in progress.
- Tissue Wand: Automatically detects and outlines tissue boundaries from raster image layers (H&E, fluorescence, raster factor maps) using marching squares contour algorithms. Features View, Layer, and interactive Island detection modes.
- Brush Tool: Freehand drawing tool to paint and add areas to your working ROI shape. Adjustable diameter (5 px – 120 px) with shortcut keys [ and ].
- Eraser Tool: Freehand carving tool to subtract areas from existing shapes, carve holes (e.g. ventricles, necrotic cores), or trim noisy borders.
- Delete / Clear (Trash): Deletes the currently selected ROI shape, or clears all unconfirmed drawings.
3. Map Tool Options Bar
Whenever an ROI drawing tool is activated, a contextual Options Bar appears across the top of the map view, providing streamlined parameter controls, real-time measurements, and execution actions:
1 2 3 | |
Polygon Mode Options Bar:
- Live Coordinates & Measurements: Displays real-time cursor coordinates (\(X\), \(Y\)) and cumulative perimeter and area with automatic unit scaling (\(\mu\text{m}\), \(\text{mm}\), \(\text{cm}\), \(\mu\text{m}^2\), \(\text{mm}^2\), \(\text{cm}^2\)).
- Multi-Polygon Summary: Displays Total Polys count and combined Total Area when drawing compound multi-part ROIs.
- Done Button: Click Done (or press Esc) to complete drawing mode while retaining shapes on the canvas.
Tissue Wand Mode Options Bar:
- Parameter Controls: Dropdowns, inputs, and modifier checkboxes to configure detection (Layer, Extent, Stain, Tolerance, Min Area, Anti-alias, Contiguous, Invert). For detailed definitions and options, see What are Tissue Wand Parameters?.
- Execution & Action Buttons:
- Run / Rerun: Samples the raster layer and executes boundary detection.
- Result Pill: Real-time status indicator displaying detected region count and vertex count (or error status).
- Add: (Hotkey Enter) Commits the detected outline into the working ROI shape.
- Reset: Restores default parameter values for the active layer.
- Clear: Removes preview outlines from the map canvas.
- Close (X): Discards preview and exits Wand mode (Esc).
Brush & Eraser Mode Options Bar:
- Tool Mode Switcher: Quick toggle between Brush (paint to add) and Eraser (paint to subtract).
- Size Slider: Adjust diameter from 5 px to 120 px (with real-time pixel readout and [ / ] keyboard hotkeys).
- History Controls: Undo (Cmd/Ctrl+Z) and Redo (Cmd/Ctrl+Shift+Z).
- Done Button: Click Done or press Esc to finish painting or carving.
4. Main Map Canvas
In the center of the map view is the main map area, where you can interact with spatial layers, zoom, pan, and draw.
5. Overview Map
Located at the bottom-left corner of the map. - Displays a miniature view of the entire dataset with a red rectangle indicating your current viewport. - Toggle Visibility: Click the Map Icon in the top header bar to show or hide the overview map.
6. Scale Bar
Located at the bottom-right corner. - Indicates the physical scale of the current view (e.g., 500 µm, 50 µm).
Related Pages
Concepts
Manual Pages
How-to Guides
FAQs