Inspector Drawer
The Inspector Drawer allows for detailed examination of individual data points (spots, cells, or pixels) directly on the map. You can view metrics like coordinates, IDs, expression counts, and assigned factors using either a quick hover tooltip or a persistent sidebar drawer.
Interface
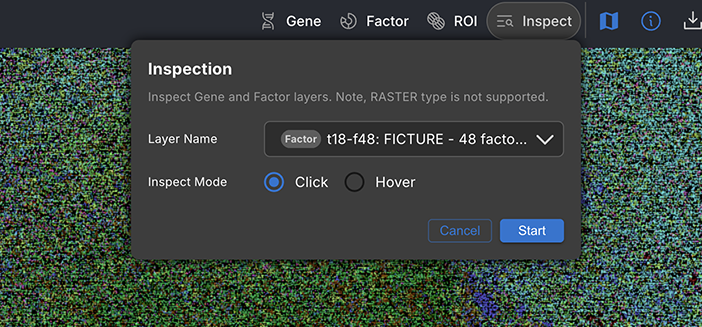
1. Inspection Configuration
Clicking the Inspect button in the Top Bar opens the configuration panel:
- Layer Name: Select the specific layer you wish to inspect. Only visible vector layers (e.g., Gene, Factor) are available.
- Inspect Mode: Choose interaction style:
- Hover: Displays details in a floating tooltip when you hover over a data point. Best for quick browsing.
- Click: Opens the Inspector Drawer on the right side when you click a data point. Best for viewing persistent details of one or multiple stacked features.
- Start/Cancel: Activates or cancels the inspection tool.
2. Inspector Views
2.1 Hover Mode (Tooltip)
In Hover mode, a tooltip appears near the cursor:
- Pagination: If multiple features overlap at the cursor location (e.g., multiple pixels in a summary view), use the Left and Right arrow keys to navigate between them.
- Summary View: The first page often shows an aggregated summary (e.g., coordinates, top factor) if applicable.
2.2 Click Mode (Inspector Drawer)
In Click mode, clicking a location opens the Inspector Drawer on the right:
- Header: Displays the layer name and type.
- List View: Lists all features found at the clicked location vertically.
- Close: Click the Close (X) button or click outside to close the drawer.
Related Pages
Concepts
Manual Pages
How-to Guides
FAQs